Global Maritime Analysis
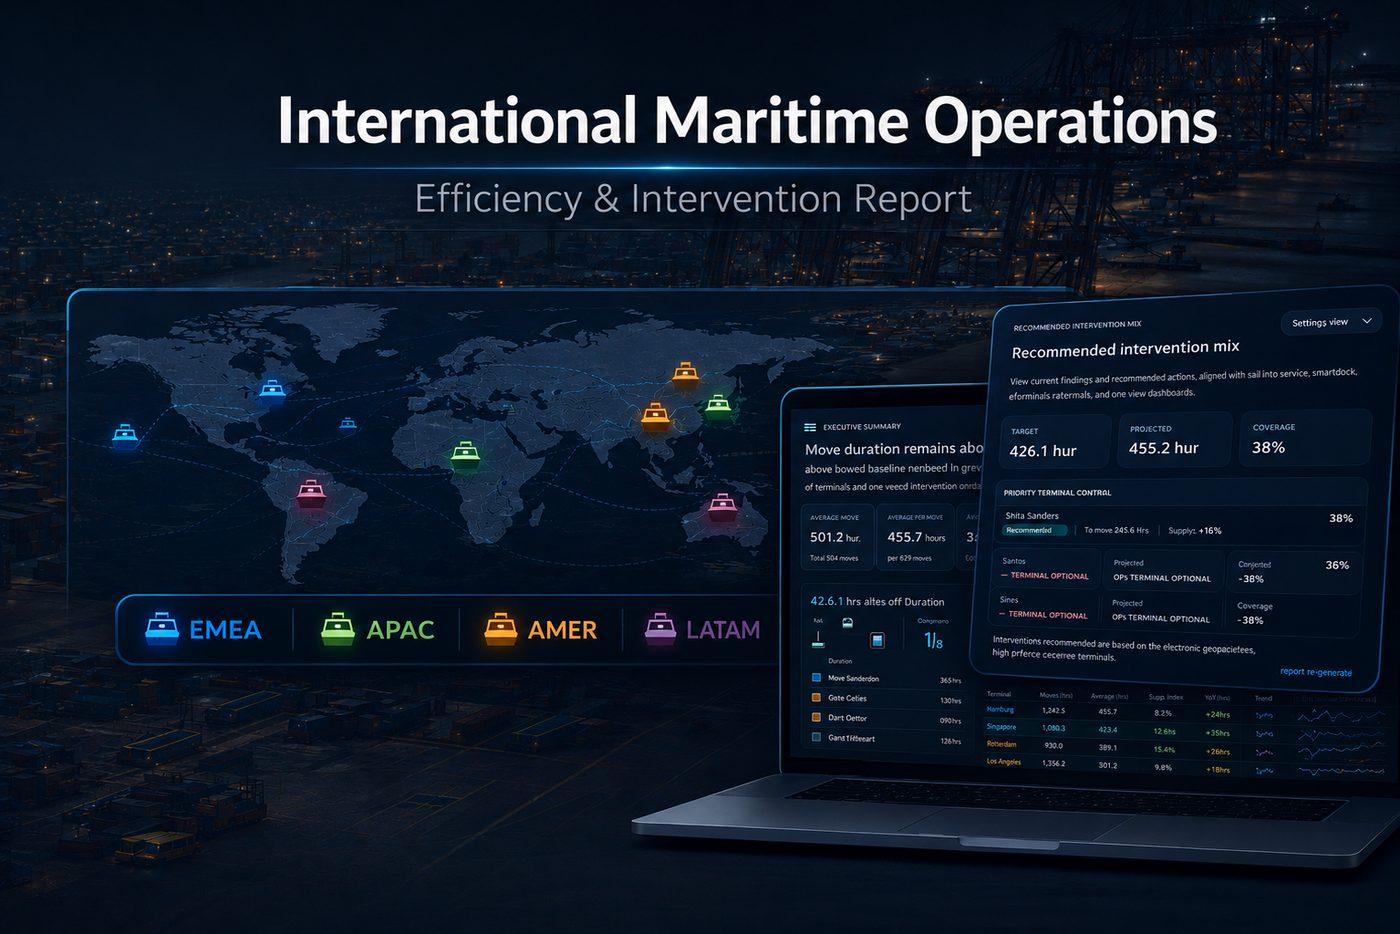
A strategic view of global terminal performance, operational efficiency and regional trends — explorable page by page. Use the slicers to dig into the data yourself.
Open full screenReal, live Power BI reports you can explore right here on the page — because a portfolio you can click tells you more than any screenshot.
These are real, working Power BI reports — not screenshots. Click Load interactive report, then explore: every page, slicer and visual responds. Best experienced on a larger screen, or use the full-screen link under each report.
A strategic view of global terminal performance, operational efficiency and regional trends — explorable page by page. Use the slicers to dig into the data yourself.
Open full screen
Sales performance across a global pharmacy market — products, regions and revenue trends brought together in one fully interactive report.
Open full screenEvery project here started with a 30-minute conversation. Yours can too.
Start the conversation